Spectrophotometric analysis and verification of Beer’s Law
- Chaitanya Singh
- Jul 26, 2025
- 9 min read

Abstract:
We designed, built, and utilized an LED-based photometer to measure the absorbance of food dyes and validate Beer’s Law [1]. The photometer used Mimm’s Effect [2], where LEDs acted as photodetectors sensitive to specific wavelengths. The circuit incorporated a transimpedance amplifier with carefully selected feedback components to amplify the photocurrent and maximize sensitivity. Complementary-colored LEDs and light sources were used to measure absorbance variations across different food dye concentrations.The experimental results demonstrated a near-linear relationship between absorbance and concentration at higher concentrations, consistent with Beer’s Law. However, deviations were observed at lower concentrations due to detector sensitivity and equipment precision. This project explored the potential and limitations of low-cost photometers.
Introduction:
Spectrophotometry is an analytical technique used to measure how much a substance absorbs light by measuring the intensity of light as a beam of light passes through a sample solution. It plays crucial roles in chemistry, biology, and environmental science for quantitative analysis of various substances. Some such applications are qualitative analysis of substances and assessing environmental pollutants based on their light-absorbing properties.
We used spectrophotometery to understand how substances absorb at specific wavelengths. We built a cost-effective LED-based photometer where LEDs acted as photodetectors by converting incident light into electrical signals.
Then we applied Beer’s Law, which relates the absorbance of a solution to its concentration, hypothesising a linear relationship between the two. Verifying this relationship with a simple photometric instrument provided practical insights into the theory behind Beer’s Law. We specifically designed to leverage the wavelength sensitivity of LEDs near their peak emission wavelengths to detect changes in light intensity after passing through solutions of food dyes.
We analyzed absorbance variations across multiple dye concentrations; the project validated Beer’s Law with a near-linear relation between concentration and absorbance and identified challenges associated with low-cost photometry, such as detector sensitivity.
Methodology:
![[Figure 1] Design schematic of the 3D-printed collimator tube](https://static.wixstatic.com/media/bfc985_2f83c5b137b44b4b92f5c75e4c2c704e~mv2.png/v1/fill/w_980,h_544,al_c,q_90,usm_0.66_1.00_0.01,enc_avif,quality_auto/bfc985_2f83c5b137b44b4b92f5c75e4c2c704e~mv2.png)
We designed a new collimator tube [Figure 1] to ensure uniform light distribution while steadily holding the sample. It was designed to optimize the alignment and accuracy of light passing through a cuvette for light intensity measurements. Its rectangular geometry and compact dimensions minimized stray light and scattering while ensuring the light beam remained collimated and uniform. We made a hole for a standard cuvette to align the sample and produce reliable absorbance readings, which are crucial for Beer's Law applications. The opaque 3D printed (PLA) material and narrow internal dimensions further reduced interference from ambient light, ensuring only transmitted light reached the detector. This practical and compact design supported accurate, repeatable measurements and simple sample handling. Misalignment of the light source can introduce errors in light transmission and absorbance measurements
![[Figure 2] Circuit diagram for photometer connected to an Arduino](https://static.wixstatic.com/media/bfc985_4d3068d0a8f24428bc59a6ab07921b4a~mv2.png/v1/fill/w_432,h_416,al_c,q_85,enc_avif,quality_auto/bfc985_4d3068d0a8f24428bc59a6ab07921b4a~mv2.png)
The LED in reverse bias acted as a photodetector. When light falls on it, it generated a small photocurrent proportional to the light intensity. The UA741 op-amp was configured as a transimpedance amplifier. The 1 MΩ feedback resistor converts the small photocurrent from the LED into a proportional output voltage.The 220 pF capacitor across the resistor ensures stability by filtering out high-frequency noise.
![[Figure 3] Color wheel from [3]](https://static.wixstatic.com/media/bfc985_77e7ac988e25428b96fab55bdfa1d4f0~mv2.png/v1/fill/w_362,h_368,al_c,q_85,enc_avif,quality_auto/bfc985_77e7ac988e25428b96fab55bdfa1d4f0~mv2.png)
For the LED that generated the photocurrent as well as the light source, we used the opposite colors on the color wheel [Figure x] to the color of the solution. If the wavelength selected for the LED that generates the photocurrent did not correspond to the solution's maximum absorption, the absorbance values would be lower and less sensitive to changes in concentration, leading to inaccurate results and poor validation of Beer’s Law.
The LED used to measure the intensity of light plays a critical role in generating the photocurrent, as it emits light at a specific wavelength that the photodetector converts into an electrical signal. We choose the color of the LED generating photocurrent to complement the solution under test, ensuring it aligns with the wavelength most absorbed by the solution. This maximizes the difference in light intensity before and after passing through the solution, leading to precise variations in the photocurrent. By ensuring effective absorption, we maximized the signal-to-noise ratio, improved sensitivity, and enhanced the precision of our measurements. We carefully selected the light source to ensure its intensity did not overwhelm our detector and lead to inaccurate measurements. Conversely, we made sure the light source was bright enough to minimize signal noise. Thus we chose a light source that could change its color (wavelength) with sufficient and necessary brightness.
Changing the feedback resistor and capacitor significantly influenced the circuit's sensitivity, stability, and response time, making the current configuration well-suited for our application. Increasing Rf made the sensor more sensitive by turning smaller photocurrents into larger output voltages. However, this came at the cost of more noise and a higher chance of saturation at higher light intensity. The 220 pF capacitor stabilized the circuit by suppressing high-frequency noise and preventing oscillations without introducing excessive response lag. This combination achieved an optimal balance between sensitivity, stability, and speed, making the circuit suitable for detecting moderate light intensities while maintaining reliable output signals.
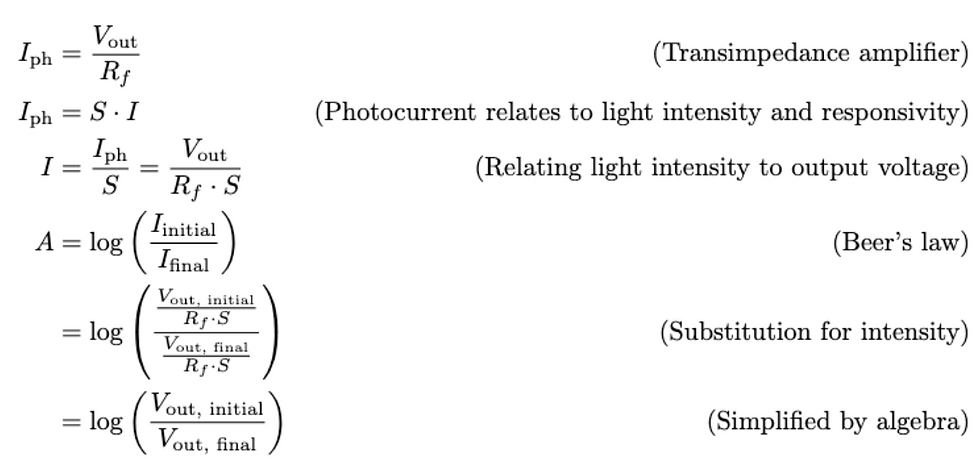
In this derivation, we calculated the absorbance for a given solution concentration by linking the measured output voltage of the transimpedance amplifier to Beer’s Law. This final expression allowed absorbance to be directly calculated from output voltages, eliminating the need for direct light intensity or photocurrent measurements and providing a practical method for determining absorbance using our circuit output.
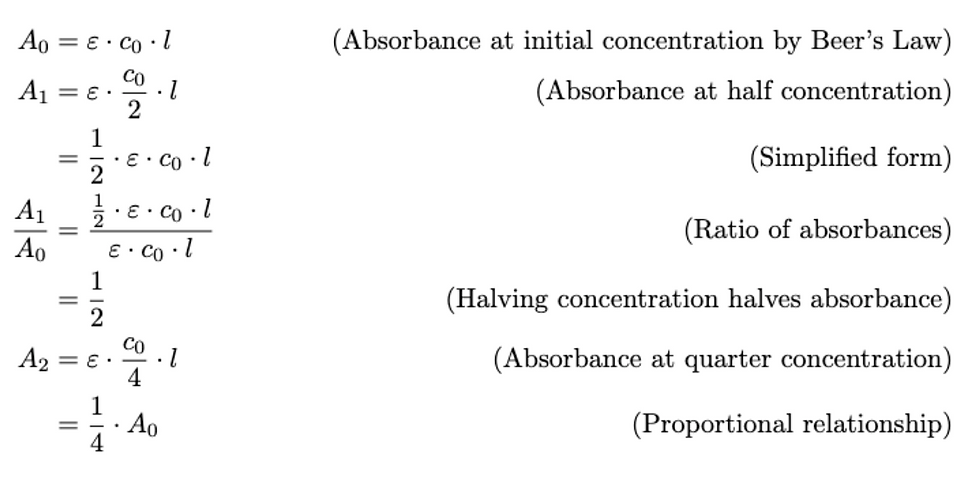
To verify the linearity in Beer's law, we varied the concentration of food dye by a factor of ½ to observe its effect on absorbance. Our hypothesis was that this variation in the concentration should decrease the absorbance linearly.
We tested three different food dyes and measured the absorbance while decreasing the concentration of the solution by a factor of 2. We specifically used colored LEDs and light sources that were opposite on the color wheel to promote effective absorption. We did not have access to orange and purple light sources or LEDs that generate photocurrent. Thus, we chose close complementary colors
Two red color-giving chemicals, ethryosine and allura red, combine to create the color of the red food dye. We used a green light source and a green LED to measure the light intensity since they are opposite on the color wheel for the red solution. Brilliant blue FCF constitutes the color of the blue food dye. We used a yellow light source and a yellow LED to measure the light intensity since it is close to orange on the color wheel for the blue solution. Tartrazine is what gives the yellow food dye its color. We used a blue light source and a blue LED to measure the light intensity since it is close to purple on the color wheel for the yellow solution.
The voltage readings in these experiments were obtained using an Arduino microcontroller as part of the measurement system. The Arduino served as an interface between the photodetection circuit and the computer, enabling real-time acquisition and processing of data.
![[Figure 4] : Experimental setup for measuring absorbance using the LED-based photometer. The flashlight serves as the light source, directing light through the sample in the cuvette, held within the custom-designed collimator tube to ensure uniform light distribution.](https://static.wixstatic.com/media/bfc985_a1a6be4e4a504d32bc326b0b2c580058~mv2.png/v1/fill/w_980,h_735,al_c,q_90,usm_0.66_1.00_0.01,enc_avif,quality_auto/bfc985_a1a6be4e4a504d32bc326b0b2c580058~mv2.png)
![[Figure 5] : Diluted red food dye solutions prepared in cuvettes for absorbance measurements](https://static.wixstatic.com/media/bfc985_4984a49082d44fc0bff84c2bd056fe40~mv2.png/v1/fill/w_606,h_448,al_c,q_85,enc_avif,quality_auto/bfc985_4984a49082d44fc0bff84c2bd056fe40~mv2.png)
Results:
Red food dye solution with green LED to measure light intensity and green light source
Table 1: Voltage measurements, calculated absorbance, expected absorbance, and percent error for red food dye solutions at varying concentrations.
Concentration | Voltage without solution | Voltage with solution | Absorbance | Expected Absorbance | Percent error |
C | 2.24V | 1.93V | 0.0647 | 0.0647 | 0% |
C/2 | 2.24V | 2.02V | 0.0448 | 0.0323 | 39% |
C/4 | 2.24V | 2.11V | 0.0260 | 0.0162 | 61% |
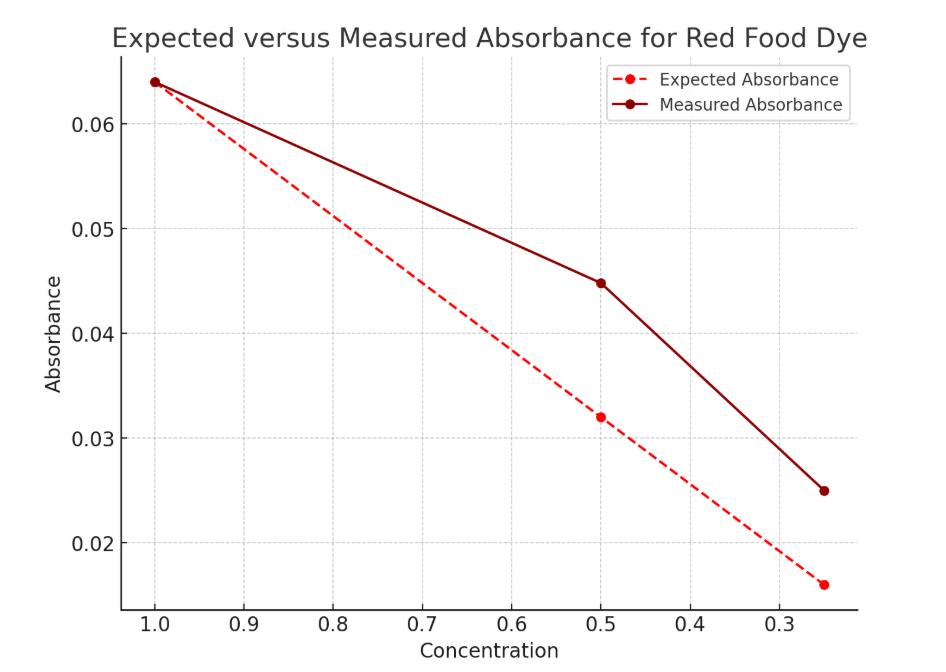
The data indicated that while the absorbance values for the undiluted solution matched the expected values with some error, deviations increased with decreasing concentration. Specifically for C/2, the measured absorbance was 39% higher than the expected value, and for C/4, the deviation rose to 61%. This trend suggested that the linear relationship between concentration and absorbance predicted by Beer’s Law was not perfectly maintained but resembled a near linear relation.
Yellow food dye solution with blue LED to measure light intensity and blue light source
Table 2: Voltage measurements, calculated absorbance, expected absorbance, and percent error for yellow food dye solution at varying concentrations.
Concentration | Voltage without solution | Voltage with solution | Absorbance | Expected Absorbance | Percent error |
C | 2.29V | 1.97V | 0.065 | 0.065 | 0% |
C/2 | 2.29V | 2.05V | 0.048 | 0.0325 | 47% |
C/4 | 2.29V | 2.14V | 0.03 | 0.0163 | 84% |
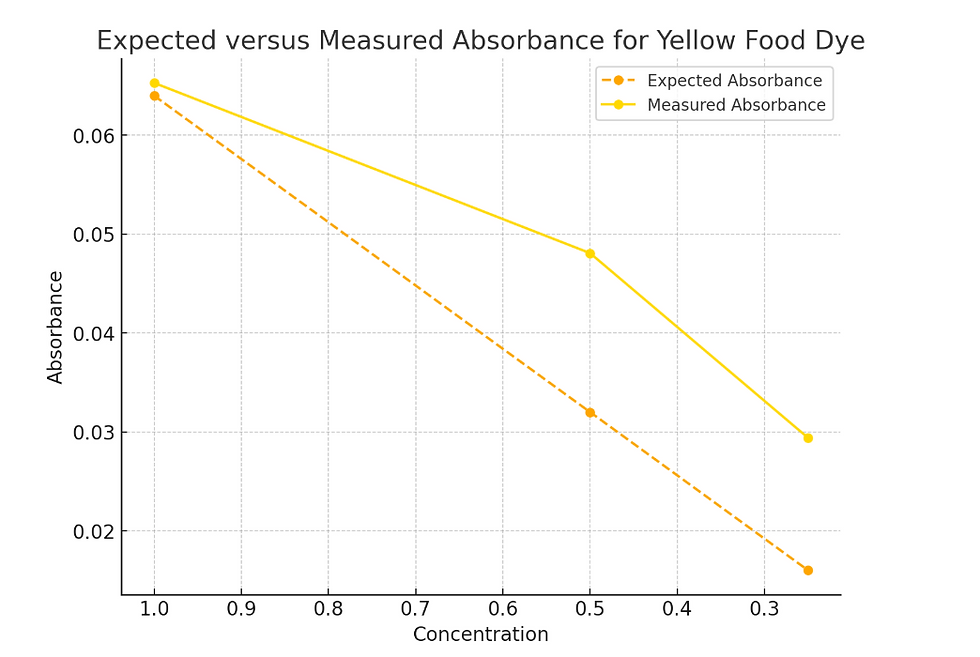
The data indicated that while the absorbance values for the undiluted solution matched the expected values with some error, deviations increased with decreasing concentration. Specifically for C/2, the measured absorbance was 47% higher than the expected value, and for C/4, the deviation rose to 84%. This trend suggested that the linear relationship between concentration and absorbance predicted by Beer’s Law was not perfectly maintained but resembled a near linear relation.
Blue solution with yellow LED to measure light intensity and yellow light source
Table 3: Voltage measurements, calculated absorbance, expected absorbance, and percent error for blue food dye solution at varying concentrations.
Concentration | Voltage without solution | Voltage with solution | Absorbance | Expected Absorbance | Percent error |
C | 2.03V | 1.88V | 0.033 | 0.033 | 0 |
C/2 | 2.03V | 1.92V | 0.024 | 0.0167 | 44% |
C/4 | 2.03V | 1.95V | 0.0175 | 0.0083 | 110% |

The data indicated that while the absorbance values for the undiluted solution matched the expected values with some error, deviations increased with decreasing concentration. Specifically for C/2, the measured absorbance was 44% higher than the expected value, and for C/4, the deviation went over a hundred percent. This trend suggested that the linear relationship between concentration and absorbance predicted by Beer’s Law was not perfectly maintained, but the trendline resembled a near-linear relation.
Discussions:
The results showed a linear relationship at higher concentrations as expected from Beer’s Law, with measured absorbance values closely matching theoretical predictions. However, deviations from linearity became significant as the concentrations were reduced to C/22 and C/4.
To improve measurement precision and obtain results that align more closely with Beer’s Law, several refinements can be made. By incorporating anti-reflective coating, we can minimize stray light and scattering. Shielding the system from external light sources with a black, opaque enclosure would further eliminate interference. Regular calibration using standard solutions of known absorbance would validate the system’s linearity and ensure consistency.
The primary limitations of the project include low sensitivity at low light intensities, noise interference, and limited resolution of data acquisition. The low sensitivity is due to the use of an LED as a photodetector, which can be addressed by replacing it with a high-sensitivity photodiode calibrated for the specific wavelength. UA741 is a general-purpose op-amp with inherent limitations. It has relatively high input noise and a lower bandwidth compared to specialized low-noise op-amps, making it less suitable for applications requiring very high precision, such as detecting small changes in light intensity. By upgrading to a low-noise, high-speed op-amp, we can fix such issues.
We are looking at incorporating multiple wavelengths by adding LEDs of different colors, enhancing the photometer's capability to perform full-spectrum analysis and detect a wider variety of substances.
Deviations from Beer’s Law at lower concentrations are likely due to inaccuracies in sample preparation, and detector nonlinearity can be solved with better calibration for standard solutions and using a more responsive photodetector. The limited resolution of the Arduino's 10-bit ADC restricts precise voltage readings. Upgrading to a higher-resolution ADC (12-bit or 16-bit) would enhance measurement accuracy.
Conclusion:
The experiment successfully demonstrated the principles of spectrophotometry and verified the application of Beer’s Law at higher concentrations of food dyes. The results indicated a clear linear relationship between concentration and absorbance at higher concentrations, with deviations becoming more pronounced as the concentration decreased. These deviations can be attributed to limitations in the experimental setup, including detector sensitivity, ambient light interference, and sample preparation errors.
To achieve more accurate and consistent results, future improvements should focus on enhancing the sensitivity and stability of the photodetection system, minimizing noise, and ensuring precise calibration with standard solutions. Incorporating advanced components such as high-sensitivity photodiodes, low-noise operational amplifiers, and higher-resolution data acquisition systems can address the identified limitations. Additionally, shielding the setup from external light sources and improving sample preparation techniques would further align the results with theoretical predictions.
Overall, the study validated the foundational concepts of Beer’s Law while providing insights into the challenges of precise absorbance measurement, particularly at low concentrations, and highlighted potential areas for refinement in spectrophotometric methods.
References:
[1] Beer, A. (1852). Determination of the absorption of red light in colored liquids. Annalen der Physik und Chemie, 86, 78–88.
[2] Mims, F. M. (1983). Sun photometer with light-emitting diodes as spectrally selective detectors. Applied Optics, 22(9), 1364–1367.
[3] Thermo Fisher Scientific. (2019). Food Dyes and Beer’s Law: Lesson plan using the SPECTRONIC 200 visible spectrophotometer.
[4] Sigman, S. B., & Wheeler, D. E. (2004). The quantitative determination of food dyes in powdered drink mixes: A high school or general science experiment. Journal of Chemical Education, 81(10), 1475–1478
Comments